


![]()
Does your hospital have any of these problems: delayed billing resulting in lost revenue, workflow noncompliance, understaffing/overstaffing, and/or training issues?
What if you could use clinical data from Epiphany Healthcare’s Cardio Server to help you improve your workflow and save money by identifying clinical inefficiencies for remediation? Wouldn’t you want to?
By helping you pinpoint problem areas in your hospital’s operations, Epiphany Healthcare enables you to forecast staffing needs, evaluate performance metrics for staff, clinics and organizations, and schedule reports with automatic delivery. How can we do all of that?
Leverage Data to Drive Quality Improvements.Request More Information.
Introducing Epiphany Analytica™!
Your Reporting Source for Improved Workflow
- Capture the right metrics across your organization. Epiphany Analytica™ identifies costly trends and opportunities for improvement.
- Identify the cause of lost ECG revenue. Epiphany Analytica™ delivers the data needed to inspire change.
- Leverage easy-to-read graphs to provide insight to those who own the process. Precisely measure and display data-driven reports.
- Utilize data to encourage quality improvements. Equip your organization with the right tools at the right time.
Analytica™ allows hospitals to examine historical data to identify trends and get a sense of how departments and staff are performing. With Analytica™, hospitals evaluate staffing needs, workload distribution, and potential training needs by comparing metrics week-to-week, month-to-month, or year-to-year. The automated reporting schedule is customizable based on the hospital’s needs. Automated report delivery eliminates delays and the risk of human error. Analytica™ graphs measure progress toward meeting goals and performance targets.
Leverage data to drive quality improvements. If you can’t measure the process, you can’t improve the process. Analytica™’s operational monitoring provides a snapshot of the health of your workflow.
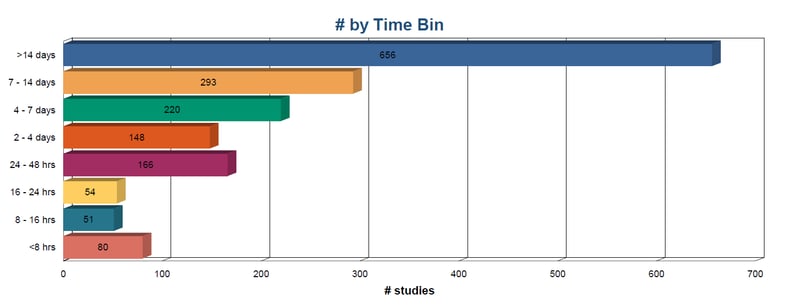
Determine at a glance the efficiency of reading physicians and sites. The unconfirmed-to-confirm time report from Analytica™ presents data on how long an ECG waits in the unconfirmed status to be read by the physician. In some states insurance companies will deny the claim if it is not processed within a specific time frame? This report allows evaluation of the readers’ efficiency in confirming a study, which is tied to how quickly the bill can go out. Delayed readings cause revenue loss due to late billing. With this report see:
- Average time studies spend in the unconfirmed status
- Average time in unconfirmed by site
- Confirmations by site
- Average time by provider to confirm studies
- Number of studies confirmed by provider
Evaluate Technicians that Perform ECGs before Receiving Order Studies Missing Orders
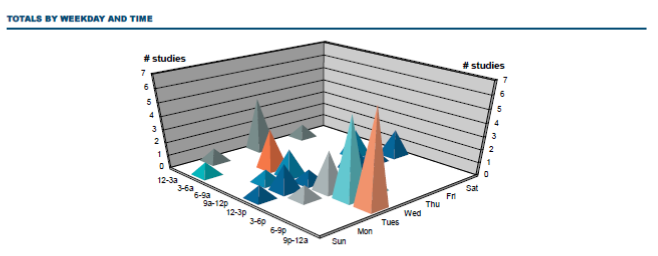
Hold your staff accountable by finding trends and quickly identifying the day of the week and the time of day when there is an increase in studies without orders. This report will shed light on the following:
- Number of studies missing orders by weekday and time of day
- Number of studies missing orders by each technician
- Number of studies missing orders by site
- The technician who performed each study
Evaluate the Effectiveness of Training and Tech Performance Create to Promote Time
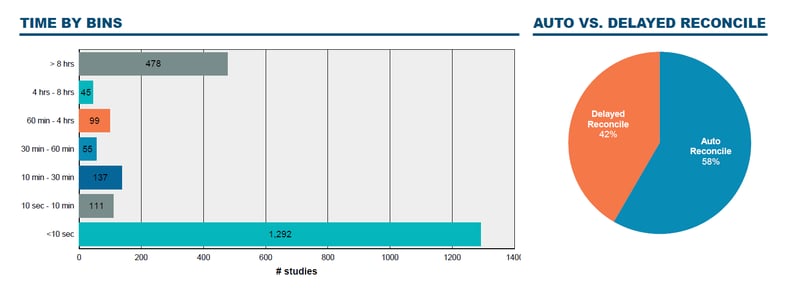
Find out the average time from creation-to-promote by each technician with this report. Determine the sites and technicians who are following protocol. This report provides data on the time required for ECGs to reconcile to an order and be made available to the reading physician and the following:
- Shows percentage of studies that auto reconcile in 10 seconds or less
- How long it takes to get the study to the provider’s box to be read
- Shows percentage of studies that have delayed reconciliation and the average delay
- Average time each site took to promote a study to the unconfirmed status where the provider can read it
Capture the right metrics across your hospital and use them to make your clinical workflow as efficient as possible. Equip your organization with the right tools at the right time to communicate the full picture. Identify the cause of lost ECG revenue by using clear graphical data. Analytica™ can identify costly trends in the clinical environment. Let it help you.